Choosing to operate your business without accurate business analytics is like running across a freeway with a blindfold on. If you are not tracking your business’ performance against previous years, you are choosing to operate your business with a blindfold on and this will eventually crush you.

Clearly understanding how your business performed in the past can be a lifesaver moving forward. This knowledge will highlight troubled areas in your business that need to be addressed and it will highlight potential areas of opportunity.
I learned this pretty early in my business career. My business leadership team and I were preparing our budgets for the upcoming year and setting targets for each area of the business. Each of us completed our area budgets and when we rolled them up, we found that our projected profitability was significantly lower than anticipated. The group discussed it but no solutions were identified until we had a report prepared that showed actual spends for each business area for the last few years. We showed each spend line item as a percentage of Revenue and it became clear very fast where the anomaly was. One of the business area leaders was trying to sneak a large budget expense without getting proper approval. He was confronted with the data and promptly removed the unauthorized spend.
One of my favorite reports is a year over year comparison report which clearly shows past years’ performance against the current year. This type of report can be used to compare income statements, cash flow statements, assets statements, growth projections or any other sort of year over year metrics.
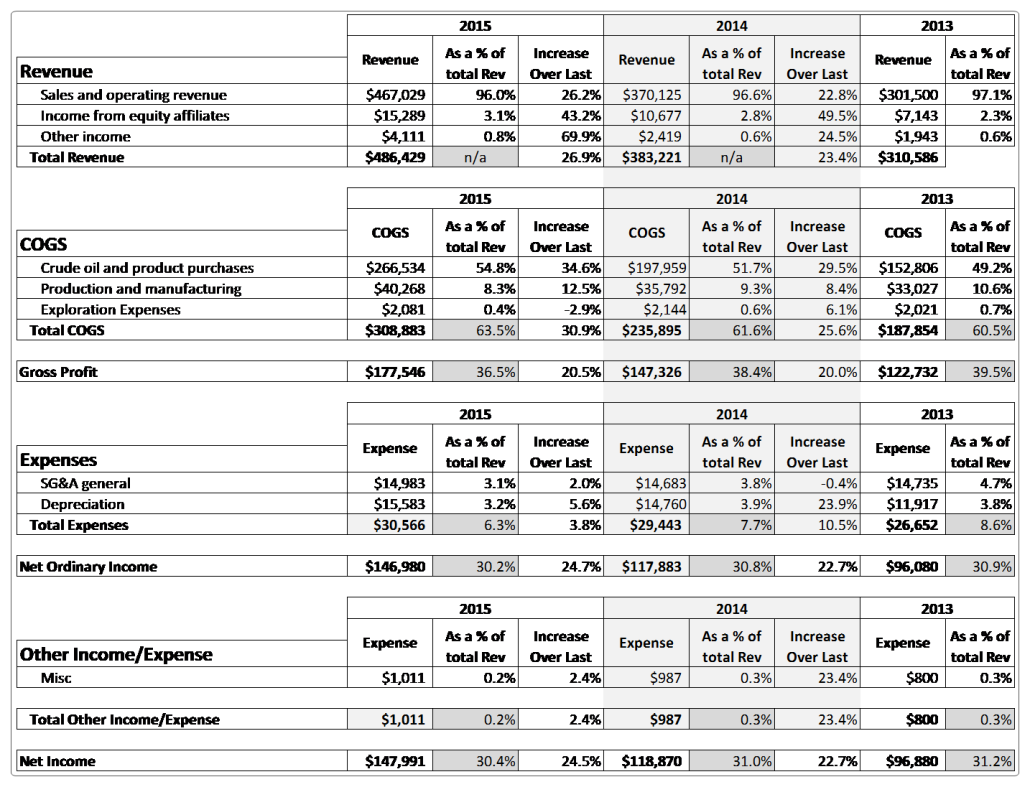
Below is an example of a year over year income statement report that is very useful in tracking the financial performance of a business. This is a very simple example that was created for this blog post. Most companies would have a lot more details than what are shown here.
Besides the obvious key numbers, this type of report shows a lot of interesting information that you can use to tweak and improve your business. The following list contains a few important insights.
- Revenue grew 23.4% from 2013 to 2014. This is a very nice growth rate. It grew another 26.9% from 2014 to 2015.
- Cost of Goods Sold (COGS) grew 20% from 2013 to 2014 and then 20.5% from 2014 to 2015.
- Expenses (or SG&A) grew 22.7% from 2013 to 2014 and another 24.7% from 2014 to 2015.
- Net Income only grew 22.7% from 2013 to 2014 and then 24.5% from 2014 to 2015. This means that Net Income is growing at a slower rate than Revenue growth. This should be a flag to the leader of this business. It appears that the COGS and Expenses are growing at a faster rate than the Revenue which is resulting in less profit.
Using these insights, this business leader should take a look at each of the components of COGS and Expenses to determine what is growing out of proportion to the Revenue growth. Perhaps they made a conscious decision to spend more in certain areas to prepare for future growth and this lower profit was expected. However, it is very possible that spending in certain areas is actually not being controlled properly and needs to be tuned and brought in line with expectations. Maybe there are economies of scale that can be leveraged as the company grows to reduce overall costs rather than increase them.
These are the type of questions and the conversations that an informed business leader can have to maximize their business’ potential. Without tools like this report, you are not able to see what is going on in the business and cannot make informed decisions to optimize the business. Take your blind fold off and take care of your business!
You can download the Yearly Financial Comparison Excel version of this report from the Business Tools page on this site. Customize it and use it to tweak and tune your business to greater levels of success.
Over the next few weeks, I will post a version of this report that allows you to do month by month comparisons so you can use this report on a monthly basis and not just yearly.
What does your business look like year over year? What tweaks and adjustments should you be making?


Please note: I reserve the right to delete comments that are offensive or off-topic.